 Zeki
ZekiAI DEMAND THERMOMETER · AS OF Q2 2026 · PROTOTYPE
ZekiRex™ AI Demand Thermometer
Q2 2026: money 97 (Overheated) · chips 90 (Overheated) · power 30 (Cooling). Money and chips are overheated; power is the one part not keeping up.
We read the three gauges separately rather than as one number: averaging lets one gauge's extreme be buried by the others (the average, for reference, is 72).
- How hot AI demand is right now, split into three gauges on the same 0–100 scale: money (investment), chips (AI chip and cloud revenue) and power (data-center construction).
- Which part cools first. Whether all three rise together, or one lags, shows where demand is bottlenecked or cracking.
- Not missing the turn in the chip and memory cycle. Cooling signals are recorded every quarter under the same rules, and whether they were right is scored in public.
prev. qtr 93
prev. qtr 70
prev. qtr 10
No alert now
Last alert: DeepSeek, Jan 2025
In 2024 power (data-center construction) ran hottest. From the second half of 2025, money and chips climbed while power cooled: more money committed, slower building. The power series is in real (inflation-adjusted) dollars, so it reads lower than the nominal figure.
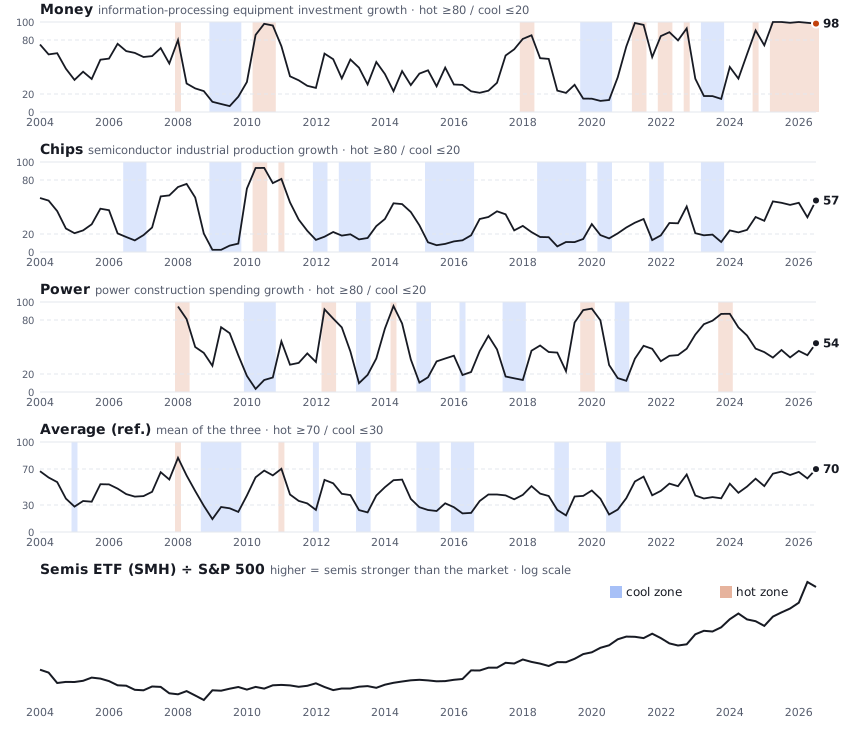
Track record — when each gauge was at an extreme (long history, proxy data)
The AI-specific numbers start in 2023. We rebuilt the same structure from official statistics going back to the 2000s and counted how semiconductor stocks did against the market after each gauge hit an extreme. The clear patterns: semis were strong after money cooled and after chips cooled. But the 11 money-cool quarters are only three cycles (2009, 2020, 2023); chips about nine. "Weak after hot" did not show up; after money ran hot, the beat rate (64%) was about the baseline.
| Gauge | Zone | Quarters | Semis (SMH) vs S&P 500 4 qtrs later, mean | Median | Beat rate | Now (pctile) |
|---|---|---|---|---|---|---|
| Money (information-processing equipment investment) | bottom 20% (cool) | 11 | +23.4%p | +19.0%p | 100% | 98 |
| Money (information-processing equipment investment) | top 20% (hot) | 14 | +20.7%p | +4.2%p | 64% | 98 |
| Chips (semiconductor industrial production) | bottom 20% (cool) | 32 | +14.3%p | +10.3%p | 84% | 57 |
| Chips (semiconductor industrial production) | top 20% (hot) | 3 | +3.4%p | +3.5%p | 100% | 57 |
| Power (power construction spending) | bottom 20% (cool) | 14 | +4.8%p | +3.1%p | 64% | 54 |
| Power (power construction spending) | top 20% (hot) | 9 | +12.8%p | +5.1%p | 89% | 54 |
2004–2026, one-quarter publication lag, percentiles from data known at the time. Baseline (all quarters): mean +11.2%p, median +5.1%p, beat rate 67% — semis beat the market over this period anyway, so what matters is beating the baseline. These zones were chosen after seeing the results, so only results from Q4 2026 on count as evidence. Four-quarter returns overlap, so independent observations are fewer. Not a buy or sell recommendation.
All zone records — from the end of each zone's first quarter, excess return vs the S&P 500
Money
| Zone | Period | Value | SMH +2Q | SMH +4Q | Micron +2Q | Micron +4Q |
|---|---|---|---|---|---|---|
| hot | 2008Q1 | 80 | -2%p | +5%p | -20%p | +8%p |
| cool | 2009Q1–2009Q4 | 7 | +4%p | +2%p | +69%p | +108%p |
| hot | 2010Q2–2010Q4 | 98 | +4%p | +4%p | -27%p | -40%p |
| hot | 2018Q1–2018Q2 | 85 | -8%p | -5%p | -24%p | -28%p |
| cool | 2019Q4–2020Q3 | 12 | +12%p | +38%p | -0%p | +24%p |
| hot | 2021Q2–2021Q3 | 99 | +7%p | -10%p | -1%p | -23%p |
| hot | 2022Q1–2022Q2 | 89 | -10%p | +7%p | -15%p | -13%p |
| hot | 2022Q4 | 93 | +34%p | +48%p | +10%p | +46%p |
| cool | 2023Q2–2023Q4 | 15 | +8%p | +48%p | +28%p | +86%p |
| hot | 2024Q4 | 91 | +10%p | +32%p | +41%p | +223%p |
| hot | 2025Q2–2026Q3 | 100 | +19%p | +114%p | +121%p | +816%p |
Chips
| Zone | Period | Value | SMH +2Q | SMH +4Q | Micron +2Q | Micron +4Q |
|---|---|---|---|---|---|---|
| cool | 2006Q3–2007Q1 | 13 | -9%p | -3%p | -37%p | -50%p |
| cool | 2009Q1–2009Q4 | 2 | +4%p | +2%p | +69%p | +108%p |
| hot | 2010Q2–2010Q3 | 93 | +4%p | +4%p | -27%p | -40%p |
| hot | 2011Q1 | 81 | -3%p | +3%p | -41%p | -36%p |
| cool | 2012Q1–2012Q2 | 13 | -13%p | -11%p | -28%p | +12%p |
| cool | 2012Q4–2013Q3 | 14 | +4%p | +2%p | +113%p | +213%p |
| cool | 2015Q2–2016Q3 | 8 | -1%p | +3%p | -24%p | -29%p |
| cool | 2018Q3–2019Q4 | 6 | +3%p | +10%p | -6%p | -7%p |
| cool | 2020Q2–2020Q3 | 15 | +22%p | +33%p | +25%p | +26%p |
| cool | 2021Q4–2022Q1 | 13 | -13%p | -15%p | -20%p | -27%p |
| cool | 2023Q2–2023Q4 | 11 | +8%p | +48%p | +28%p | +86%p |
Power
| Zone | Period | Value | SMH +2Q | SMH +4Q | Micron +2Q | Micron +4Q |
|---|---|---|---|---|---|---|
| hot | 2008Q1–2008Q2 | 95 | -2%p | +5%p | -20%p | +8%p |
| cool | 2010Q1–2010Q4 | 3 | +2%p | +11%p | -28%p | -3%p |
| hot | 2012Q2–2012Q3 | 92 | -3%p | +1%p | -4%p | +109%p |
| cool | 2013Q2–2013Q3 | 10 | -3%p | +9%p | +37%p | +108%p |
| hot | 2014Q2 | 96 | +5%p | +5%p | +1%p | -48%p |
| cool | 2015Q1–2015Q2 | 10 | -3%p | +0%p | -38%p | -61%p |
| cool | 2016Q2 | 19 | +19%p | +28%p | +53%p | +102%p |
| cool | 2017Q3–2018Q1 | 13 | +7%p | -2%p | +28%p | -1%p |
| hot | 2019Q4–2020Q1 | 93 | +12%p | +38%p | -0%p | +24%p |
| cool | 2020Q4–2021Q1 | 12 | +6%p | +14%p | -1%p | -3%p |
| hot | 2023Q4–2024Q1 | 87 | +35%p | +15%p | +40%p | -25%p |
Average (ref.)
| Zone | Period | Value | SMH +2Q | SMH +4Q | Micron +2Q | Micron +4Q |
|---|---|---|---|---|---|---|
| cool | 2005Q1 | 28 | +9%p | +2%p | +24%p | +33%p |
| hot | 2008Q1 | 82 | -2%p | +5%p | -20%p | +8%p |
| cool | 2008Q4–2009Q4 | 14 | +20%p | +35%p | +90%p | +277%p |
| hot | 2011Q1 | 70 | -3%p | +3%p | -41%p | -36%p |
| cool | 2012Q1 | 25 | -13%p | -11%p | -28%p | +12%p |
| cool | 2013Q2–2013Q3 | 22 | -3%p | +9%p | +37%p | +108%p |
| cool | 2015Q1–2015Q3 | 23 | -3%p | +0%p | -38%p | -61%p |
| cool | 2016Q1–2016Q3 | 21 | +21%p | +30%p | +65%p | +161%p |
| cool | 2019Q1–2019Q2 | 18 | +7%p | +19%p | -1%p | +11%p |
| cool | 2020Q3–2020Q4 | 19 | +21%p | +19%p | +69%p | +23%p |
Correlation — looking at the extremes too
Linear correlations are all near zero: there is no "higher is better" relationship; meaning shows up only at the extremes. So we also measured being in the cool zone, the hot zone, and extremeness. Money's extremeness is the largest (+0.39 to +0.42), but shorten the period and the hot side disappears (+0.00 through 2024) while the cool side stays (+0.33). Chips, power and the average show no signal.
| Gauge | Measure | SMH +2Q | SMH +4Q | Micron +2Q | Micron +4Q |
|---|---|---|---|---|---|
| Money | Linear | -0.00 | -0.03 | +0.08 | +0.13 |
| Rank | -0.20 | -0.25 | -0.17 | -0.25 | |
| In cool zone | +0.24 | +0.21 | +0.12 | -0.03 | |
| In hot zone | +0.21 | +0.19 | +0.24 | +0.22 | |
| Extremeness |v−50| | +0.42 | +0.39 | +0.38 | +0.27 | |
| Chips | Linear | -0.03 | -0.09 | -0.02 | +0.00 |
| Rank | -0.10 | -0.20 | -0.13 | -0.20 | |
| In cool zone | +0.07 | +0.11 | +0.05 | -0.01 | |
| In hot zone | -0.03 | -0.07 | -0.09 | -0.11 | |
| Extremeness |v−50| | -0.10 | -0.01 | -0.14 | -0.13 | |
| Power | Linear | +0.07 | +0.13 | -0.01 | +0.02 |
| Rank | +0.12 | +0.20 | +0.06 | +0.16 | |
| In cool zone | -0.18 | -0.24 | -0.17 | -0.19 | |
| In hot zone | -0.03 | -0.05 | -0.14 | -0.06 | |
| Extremeness |v−50| | -0.15 | -0.20 | -0.23 | -0.26 | |
| Average (ref.) | Linear | -0.01 | -0.01 | +0.02 | +0.08 |
| Rank | -0.14 | -0.15 | -0.15 | -0.21 | |
| In cool zone | +0.04 | +0.05 | +0.09 | +0.05 | |
| In hot zone | -0.08 | -0.05 | -0.14 | -0.07 | |
| Extremeness |v−50| | +0.09 | +0.04 | +0.15 | +0.08 |
Threshold: beyond ±0.30 for +2Q and ±0.42 for +4Q to rule out chance (overlapping returns mean fewer independent observations). Blue = positive, orange = negative.
Money — does the result rest on the recent boom alone?
| Period | Cool · SMH +4Q | Cool · Micron +4Q | Hot · SMH +4Q | Hot · Micron +4Q |
|---|---|---|---|---|
| All, 2004–2026 | +0.21 | -0.03 | +0.19 | +0.22 |
| Through 2024 (recent boom excluded) | +0.33 | +0.05 | +0.00 | -0.09 |
| Through 2021 | +0.32 | +0.06 | -0.18 | -0.22 |
The numbers in Q2 2026
| Gauge | Indicator | Value (YoY) |
|---|---|---|
| Money | Big-5 (MSFT·GOOGL·AMZN·META·ORCL) capex growth | +86.5% |
| Money | Capex ÷ operating cash flow | 97.4% |
| Money | Backlog (RPO) growth, MSFT·AMZN | +108.5% |
| Chips | NVIDIA data-center revenue growth | +116.6% |
| Chips | Average growth, AWS · Google Cloud · Azure | +54.0% |
| Power | US data-center construction spending (real, quarterly sum) | +31.7% |
Rules (fixed)
- Money, chips and power are each shown on their own 0–100 percentile scale. Their average is given for reference only.
- Each indicator uses year-over-year growth, converted to a percentile against a fixed base window, Q1 2024–Q2 2026. The base window will not be changed later.
- Efficiency shock (doing the same work with fewer resources) is shown as an alert, not a number.
- Bands: overheated 80+ · hot 60–80 · normal 40–60 · cooling 20–40 · cold under 20. Arrows compare with the previous quarter.
- Watched alongside: memory stocks' strength relative to the S&P 500. In all four past DRAM cycles it turned at or before the price peak.
Scoring — the average over the last 10 quarters
Over the past 10 quarters, correlations between the reading and next-quarter memory measures were all near zero or weakly negative. Ten points cannot tell signal from chance.
| Comparison | Correlation |
|---|---|
| Reading → next-quarter DRAM contract price change | −0.28 |
| Reading → next-quarter average return, three memory makers | −0.21 |
| Change in reading → next-quarter DRAM contract price | 0.08 |
| Change in reading → next-quarter memory stocks | −0.05 |
How to read this: with 10 data points, a correlation must exceed ±0.63 before it can be told apart from chance (5% significance). All four values are less than half that. The data so far could not confirm a relationship — which is not proof that none exists.
Of 16 quarters of DRAM contract prices, only 2 are actuals; the rest are TrendForce forecast midpoints. The whole period was an upcycle in which demand never cooled. The first public scoring comes after all Q3 2026 results are out (early November), on this page and in the weekend edition.
Limits
- This is a prototype. Some figures come from secondary sources (stockanalysis.com, Our World in Data) and are being checked against company releases. Anything that changes will be corrected, and the correction noted.
- Power rests on a single indicator.
- Much of the backlog growth comes from a few large contracts; demand may lean on single customers.
Sources: company earnings releases · stockanalysis.com quarterly cash-flow statements · US Census Bureau construction spending (via Our World in Data) · TrendForce DRAM contract prices. For information only; not investment advice. Past results do not guarantee future returns.